SEO teams who want to measure AI visibility in Google Search Console face a new kind of reporting problem. Classic metrics still matter, yet generative experiences now sit between searchers and your pages. You need a way to see when AI Overviews borrow your work, when they send traffic, and when they answer the question without a click. That means treating AI surfaces as another search placement, not as a separate channel.
What “AI visibility” actually means
Many teams throw around the phrase “AI visibility” without agreeing on what they track. Some mean brand presence inside AI answers. Others care only about traffic. A few try to follow both, plus softer signals like influence on purchase decisions. Before you build dashboards, you must decide what your own team wants to see and act on.
In practice, AI visibility usually blends three layers. You have technical eligibility, where Google can crawl, index and quote your content in its generative experiences. You then have surface-level presence, where AI Overviews or chat-style answers show your site as a citation. Finally you have behavioral outcomes, where users click or use your information without clicking at all.
This layered view matters because different stakeholders care about different parts. Product managers may obsess over brand presence inside answers. Performance marketers may focus on traffic and conversions. Leadership may want a directional read on how much AI now mediates your category. Your reporting needs to separate those ideas, even if you roll them up later.
To keep discussions grounded, define AI visibility as a set of measurable states, not a vibe. A useful working model breaks it into:
Eligible: the page can appear in AI experiences and meets the technical requirements.
Cited: the page appears as a visible source in an AI answer.
Clicked: the page receives a click from an AI surface.
Influential: the answer uses your unique angle or data, even with low click volume.
When you explain these states, stakeholders understand that AI visibility is not a single dial that moves up or down. It is a set of related signals that you can track, compare, and optimize.
Three different things people call AI visibility
Conversations often mix three concepts under one label. Some people talk about how often AI Overviews show your brand name. Others mean how many impressions and clicks AI surfaces generate in Search Console. A third group cares about how strongly AI answers echo your original research or frameworks. You should keep these buckets separate in your notes and reports.
What a single number cannot tell you
Teams often ask for one score that sums up AI performance. That instinct sounds tidy but hides real trade-offs. A strong brand presence in answers can coexist with shrinking organic traffic. A page might win many AI impressions yet never earn a click. A single roll-up metric cannot show those tensions. You need a small set of clear numbers and a narrative, not one composite score.
Where Google reports generative AI performance today
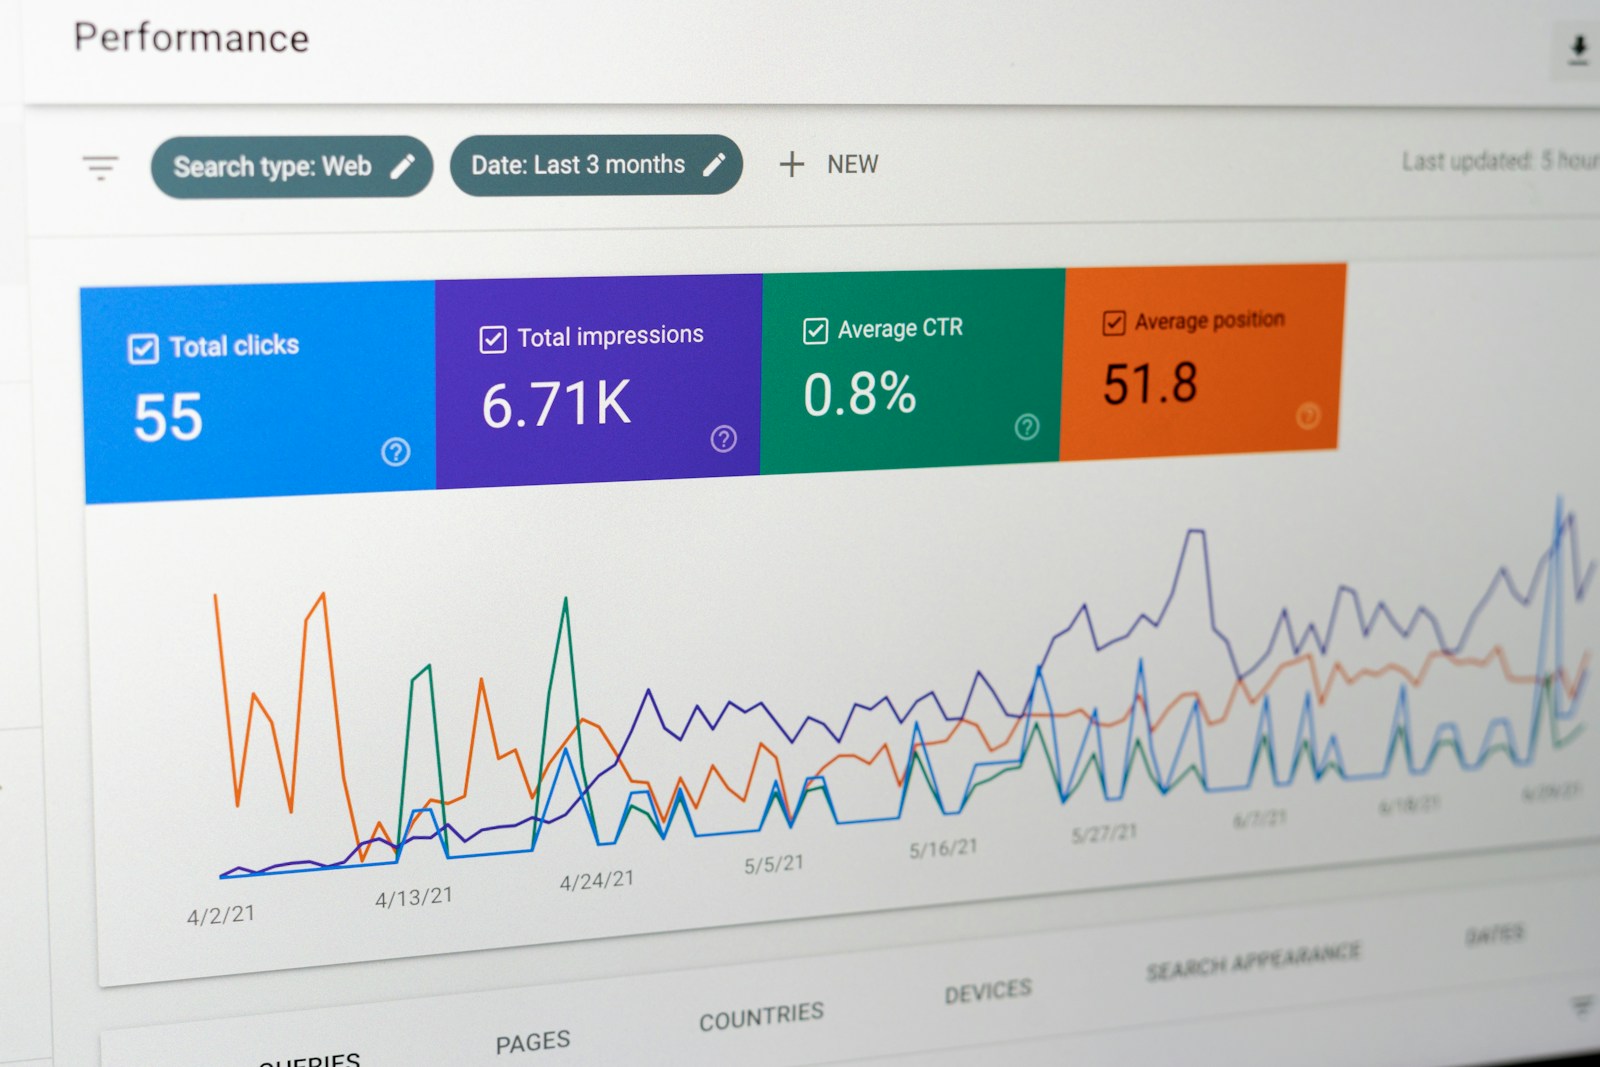
Google now folds generative experiences into its main reporting rather than launching a separate dashboard. The company states that Search Console reports performance data for its generative AI experiences inside the Performance report, so impressions and clicks from AI surfaces sit alongside classic search data. That design choice keeps everything in one place but forces you to tease apart surfaces using filters and comparisons.
Content shown in Google’s AI experiences comes from its regular web index. The same snippet controls still apply, including nosnippet, max-snippet, and data-nosnippet. In other words, the page that ranks is the page that AI can quote. If you block snippets too aggressively, you might protect some text yet lose presence in overviews that could have sent qualified traffic.
Google also states there is no special markup, schema type, or file that makes a page eligible for AI Overviews or AI Mode. Eligibility follows ordinary Search technical requirements, along with its people-first content guidance. That guidance stresses unique, non-commodity content, clear authorship, provenance, and a satisfying page experience. AI visibility grows from the same foundations as classic search visibility, just with different presentation layers.
For measurement, you treat AI surfaces as another dimension inside existing reports. You work with:
Impressions attributed to AI experiences versus traditional blue links.
Clicks from AI placements compared with standard results.
Queries where AI Overviews appear and mention your site.
Pages that AI cites most often across those queries.
Because interfaces evolve, you should confirm the current labels and filters in your own account. Look for ways to segment data by search appearance type or a similar breakdown. When in doubt, document how you set up each filter so you can repeat the view next month and compare like with like.
It lives inside the Performance report, not a separate tool
Many marketers still expect a dedicated “AI” tab somewhere in Search Console. Instead, Google chose to keep everything inside the Performance report. You use its filters and breakdowns to isolate AI experiences from traditional results. This approach keeps your workflow familiar but demands more care when you define saved views, exports, and dashboards.
Confirm the current labels in your own account
Because interface labels change, you should never rely on outdated screenshots from blog posts — including this one. Open the Performance report and inspect the available appearance or experience filters. Note down the exact labels you see and how they group. Share that list with your team so everyone uses the same definitions when they talk about AI impressions and clicks.
What Bing Webmaster Tools adds
Bing took a slightly different route by introducing an AI Performance report in public preview inside Bing Webmaster Tools. This report, announced in February 2026, gives site owners first-party data on how their pages appear in Bing’s AI answers and in Copilot. You can see how Bing’s generative experiences surface your content alongside classic results.
That extra view matters because many brands now receive meaningful traffic from Copilot and chat-style answers. Bing’s AI Performance report helps you understand which queries trigger AI answers that cite your pages. It also shows how often users click through from those experiences. While still in preview, it already complements your Search Console work and rounds out your cross-engine picture.
Building a monthly AI visibility view
Once you understand where the data lives, you can build a monthly view that leadership can trust. The goal is not a perfect model. The goal is a consistent, repeatable snapshot that shows how AI surfaces treat your site over time. Think of it as an extra layer on top of your existing SEO reporting, not a replacement.
A practical monthly view usually combines four core numbers, a few directional ratios, and some qualitative notes. The four numbers form the backbone of your AI reporting. The ratios help you explain shifts without drowning stakeholders in raw exports. Qualitative notes capture changes in answer wording, competitor citations, and new surfaces that appear in the interfaces.
At minimum, your monthly AI visibility packet should track:
AI impressions for your site across all queries.
AI clicks from those impressions.
Classic search impressions for the same pages and queries.
Classic search clicks for the same set.
When you keep classic and AI numbers in one place, you can show trade-offs clearly. A spike in AI impressions might coincide with flat total clicks if users stay inside answers. A drop in classic impressions might hurt vanity metrics yet still deliver revenue if AI answers highlight your product comparisons more often. Your monthly view should highlight these patterns with short commentary, not just charts.
Four numbers that belong in the report
Every month, log four headline metrics for AI surfaces. Start with total impressions attributed to AI experiences. Add total clicks from those impressions. Then mirror those two numbers with classic search impressions and clicks for the same pages. This simple set lets you see whether AI growth adds to your existing organic traffic or eats into it.
Classic surfaces and AI surfaces, side by side
Stakeholders understand change faster when you place classic and AI surfaces next to each other. The two columns do not measure the same thing, and saying so out loud prevents a lot of confused reporting.
| Classic surfaces | AI surfaces |
|---|---|---|
What an impression means | Your result was shown in the list | Your page was used or cited inside a generated answer |
Expected next step | A click | Often none — the answer completes the task |
Where the data lives | Performance report | Performance report, filtered to the AI experience |
What it cannot tell you | Which snippet was shown | Which passage was quoted |
A comparison like this often reveals that AI Overviews now drive more impressions but fewer clicks than the old ten-blue-link layout. That insight guides content and UX experiments more than any single blended metric.

The manual query panel that fills the gaps
Even a good monthly dashboard will miss important nuance. AI experiences behave differently by query, by intent, and by device. To catch those details, you need a manual query panel that you review on a fixed cadence. Think of it as a curated set of search terms you watch by hand to see how AI treats your brand in context.
This panel looks old-fashioned, yet it reveals things aggregates hide. You see which competitors appear alongside you in overviews. You notice when an answer stops citing your site even though your ranking stays stable. You catch shifts in language that suggest engines now favor a different framing of the problem. Those changes rarely show up cleanly in numeric reports.
A strong query panel usually focuses on:
High-value commercial queries where AI answers could replace comparison pages.
Brand-plus-category queries where reputation matters.
Informational terms where you publish deep, unique research.
Emerging topics where you expect AI Overviews to evolve quickly.
Run these queries in Google Search and, where relevant, in Bing’s AI experiences. Do it from a neutral context, avoiding heavy personalization. Then record what you see in a simple spreadsheet or note system. Over a few months, patterns emerge that help you explain shifts in traffic and shape your content roadmap.
Choosing the ten queries you rerun every month
Start your panel with ten queries that truly matter to your business. Include at least three high-intent commercial terms, a few mid-funnel research phrases, and your main brand-plus-category search. Add one or two emerging topics where you publish thought leadership. These ten terms give you a compact yet rich window into how AI Overviews treat your domain.
What to record for each one
For every query in the panel, capture whether an AI answer appeared, whether your site appears as a citation, how many competitors share that space, and any notable wording around your brand. Note whether the answer seems to remove the need to click. Over time, you will see which themes keep your citations and which ones drift away.
What these reports cannot tell you
Even the best dashboards leave blind spots. Teams who measure AI visibility in Google Search Console sometimes expect a level of precision that the tools simply do not offer. You need to know those limits so you do not over-interpret noisy data or promise insights you cannot deliver.
First, neither Google nor Bing publishes a per-answer citation log. Their reports show aggregate impressions and clicks tied to AI surfaces, not a record of which specific answer quoted which specific passage. You cannot trace one spike in traffic back to one exact answer variation. You can only infer patterns from repeated observations and broader metrics.
Second, Search Console covers Google Search, not every assistant that might reuse web content. Other systems, including tools built on models such as ChatGPT, may pull from your pages without sending measurable traffic or reporting impressions. That means your real influence on generative experiences across the web will always exceed what the dashboards show.
Third, these reports do not capture how often users read AI answers without clicking anywhere. You see impressions and clicks, yet you never see the attention that stays inside the interface. For content that aims to shape category understanding rather than drive direct response, that hidden influence can matter more than the click count.
When you explain these gaps clearly, stakeholders learn to treat AI metrics as directional. They stop chasing false precision and start asking better questions about patterns, trends, and strategic positioning.
Other assistants are not in your dashboard
Your Search Console data tells you nothing about how other assistants reuse your content. Tools that run on large language models may crawl the open web, then answer questions without any link back to your site. You cannot see those interactions, so you should not treat Search Console as a full map of your generative footprint.
There is no per-answer citation log
Many marketers hope for a log that lists every AI answer and the sources it used. Neither Google nor Bing provides that level of detail. You only see aggregated impressions and clicks by query, page, and surface type. That limitation makes your manual query panel and qualitative observations even more important.
Turning measurement into a decision
Data only matters when it changes what you do. Once you track AI impressions, clicks, and manual query observations, you must turn those signals into clear decisions. That often means choosing where to double down, where to accept cannibalization, and where to defend classic placements more aggressively.
A good starting point is to classify pages by how they perform across AI and traditional surfaces. Some pages will shine inside AI Overviews yet draw few direct clicks. Others will rarely appear in generative answers but still win steady organic traffic. A smaller group will do both. Your job is to decide which role each page should play and optimize accordingly.
In many cases, the most important takeaway is simple: some content should be designed primarily to be a good source, not to win the click. Deep explainer pages and research pieces may work best as material that feeds authoritative overviews. Meanwhile, buying guides and product comparisons might still need strong classic rankings and compelling snippets to earn visits.
To move from measurement to action, consider three levers:
Rewrite sections so AI Overviews can lift clearer, self-contained explanations.
Strengthen authorship and provenance signals on pages that already earn AI citations.
Shift internal linking to support pages that convert well from AI-driven visits.
Over time, you build a portfolio where some assets focus on shaping answers, some focus on capturing clicks, and some bridge both. That portfolio mindset keeps you from chasing every small fluctuation in AI metrics and helps you make deliberate trade-offs.
When a page is visible but never cited
Sometimes you rank well in classic results while AI Overviews ignore your page. That gap often signals that your content repeats commodity information or buries the clearest explanation too deep. In those cases, tighten your structure, surface unique insights near the top, and make your key definitions easy for engines to quote. Then watch whether citations start to appear over the next few cycles.
When it is cited but nobody clicks
Other times, AI answers cite your page frequently yet send very few visits. That pattern usually means the overview already satisfies the query. You can respond by targeting deeper follow-up questions, adding tools or calculators that require a visit, or reframing your content to create curiosity beyond the summary. The goal is not to fight the overview but to give users a strong reason to continue on your site.
Frequently asked questions
How soon after publishing should I expect AI data?
You usually see initial AI-related impressions once Google indexes and starts testing your page in relevant queries. That timing varies by site authority and crawl patterns. Track new URLs in the Performance report and watch for appearance-type segments as they populate.
Can I separate AI impressions from classic impressions?
You can separate them to a useful degree using the appearance or experience filters inside the Performance report. These filters change over time, so confirm the current labels in your account. Then save consistent views so you can compare AI and classic impressions month over month.
Do I need a third-party tool to track AI visibility?
You do not need one to start, because Search Console and Bing Webmaster Tools already expose core AI performance data. Some teams use external tools to automate exports, blend sources, or visualize trends. Begin with the native reports, then add tooling if your workflow demands more automation.
What should I do if AI impressions rise but clicks fall?
First confirm whether classic clicks also changed, then review key queries in your manual panel. Rising AI impressions with falling clicks often mean answers now satisfy more of the intent. Respond by adding deeper follow-up content, interactive elements, or stronger reasons to visit.
How often should I refresh the query panel?
Refresh your manual query panel at least monthly, aligned with your reporting cycle. For volatile topics or big product launches, consider a lighter mid-month check. Update the query list a few times a year so it still reflects your highest-value search themes.